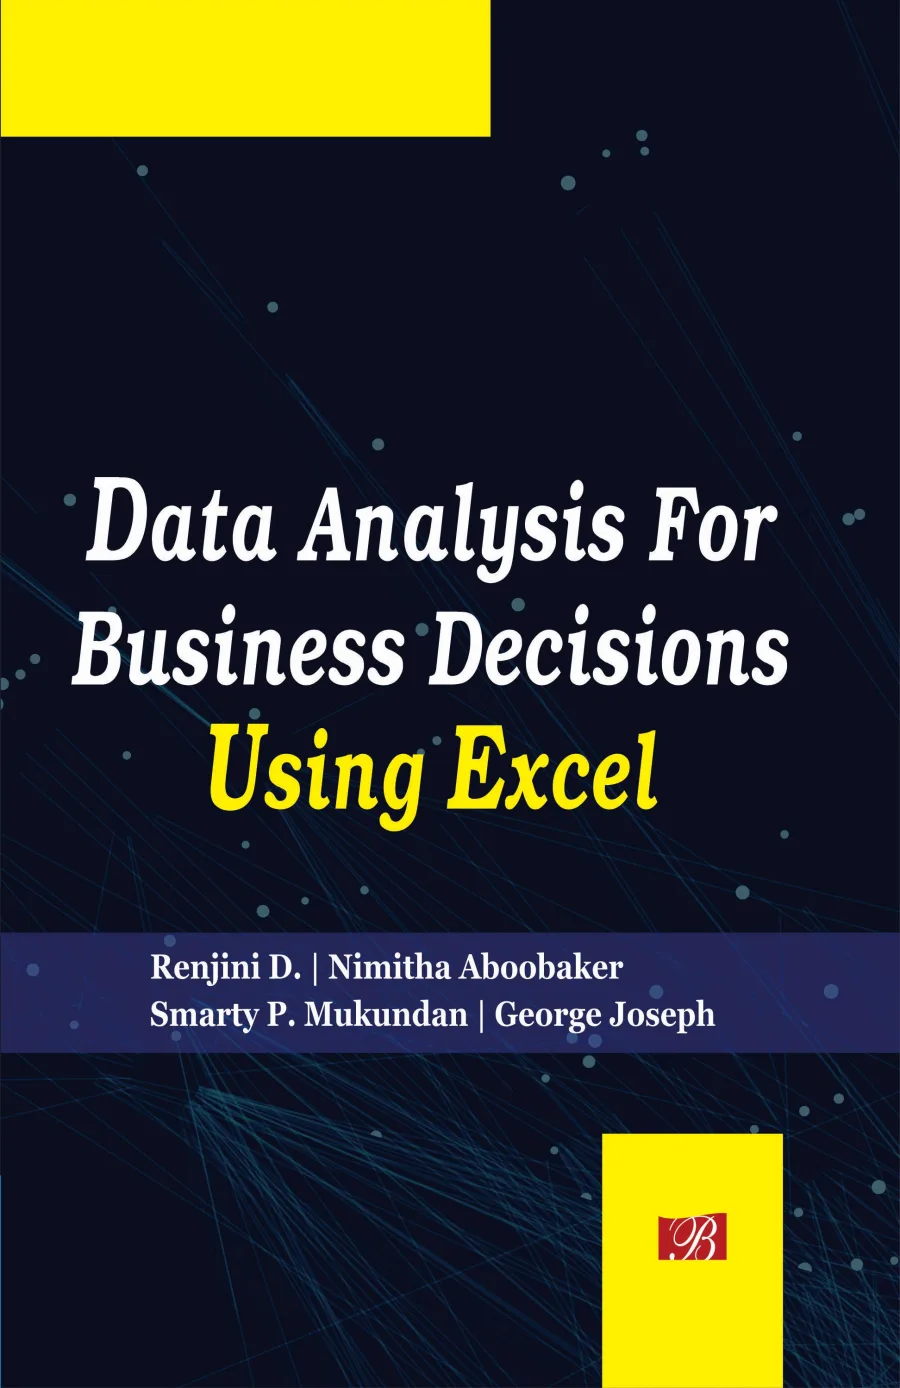
DATA ANALYSIS FOR BUSINESS DECISIONS USING EXCEL
Dr. Renjini D., Dr. Nimitha Aboobaker
Paperback
• 172 Pages
• inr 290.00
• English
• 9789389657029
No ratings yet
| Publisher | Bharti Publications |
|---|---|
| Brand/Group | Bharti Publications |
| ISBN13 | 9789389657029 |
| ASIN/SKU | 9389657024 |
| Book Format | Paperback |
| Language | English |
| Pages | 172 |
| List Price | inr 290.00 |
| Dimensions | 15.5 x 2 x 24 |
| Weight | 299 |
| Book Code | BD00067305 |
Discover DATA ANALYSIS FOR BUSINESS DECISIONS USING EXCEL by Dr. Renjini D.. This book is published by Bharti Publications in Paperback format, ISBN 9789389657029, ASIN 9389657024, under Databases and Big Data.
Book Description
In the contemporary digital economy, data has emerged as one of the most critical assets for businesses with organizations generating unprecedented amounts of data. Combined with sophisticated analytical tools and massive computing power, businesses can now be truly driven by data to more informed business and strategic decisions. The book discusses various statistical data analysis tools used in business decision making and how to perform these tools using MS Excel. Each tool is discussed using suitable cases and examples from business and the step-by-step procedure in Excel is elaborated with screenshots of each step. The book focusses on building skills in effectively using Excel in the context of business applications of statistical data analysis tools. Simple and easy to understand the approach used in the book will help even readers with no prior knowledge of Excel or statistical tools. After reading the book, the reader will be able to: create and edit Excel spreadsheets; create pivot tables; visualize data; make statistical inferences using ANOVA, correlation, and regression; perform time series analysis, and execute statistical quality control tools.
Author Biography
Author Biography will be added soon…
Editorial Reviews
Editorial Reviews will be added soon…
Book Summary
In today's rapidly evolving digital economy, data has become one of the most valuable resources available to organizations. Every business, regardless of its size or industry, generates vast amounts of data through its daily operations. However, the true value of this data lies not in its collection but in its effective analysis and interpretation. Organizations that can transform raw data into meaningful insights gain a significant competitive advantage by making informed strategic and operational decisions. Recognizing this growing importance of data-driven decision-making, this book provides a practical and comprehensive guide to statistical data analysis using one of the world's most accessible and widely used software applications—Microsoft Excel.
The primary objective of this book is to bridge the gap between statistical theory and its practical application in business environments. Rather than presenting statistical concepts in an abstract mathematical manner, the book demonstrates how these concepts can be effectively implemented using Excel. It is specifically designed for students, researchers, business professionals, entrepreneurs, managers, and anyone interested in learning how statistical tools can support better decision-making. No prior expertise in advanced statistics or Excel is assumed, making the content suitable for beginners while remaining valuable for experienced users seeking to strengthen their analytical skills.
The book begins by introducing readers to the fundamentals of Microsoft Excel, familiarizing them with its interface, essential functions, and worksheet operations. Readers learn how to create, organize, edit, and format spreadsheets efficiently, laying the foundation for more advanced analytical techniques. Since clean and well-structured data is the cornerstone of meaningful analysis, considerable attention is devoted to data preparation, organization, and management. The step-by-step approach ensures that readers become comfortable with Excel before progressing to more sophisticated statistical procedures.
One of the major strengths of the book is its emphasis on practical learning through real-world business examples and case studies. Every statistical tool is introduced in the context of solving genuine business problems. Instead of relying solely on theoretical explanations, the book demonstrates how statistical methods can be applied to marketing, finance, operations, production, human resource management, sales, customer analytics, and quality management. This practical orientation enables readers to understand not only how to perform statistical analyses but also why they are useful in specific business situations.
Data visualization plays a central role in communicating analytical findings, and the book provides extensive guidance on creating effective visual representations of data using Excel. Readers learn to construct charts, graphs, dashboards, and pivot tables that transform complex numerical information into clear and meaningful visual insights. These visualization techniques assist managers and decision-makers in identifying trends, patterns, and anomalies quickly, thereby facilitating evidence-based decision-making.
The book thoroughly explores descriptive statistical techniques that summarize and present data in an understandable manner. Measures of central tendency, variability, frequency distributions, and graphical representations are explained with practical examples. These foundational concepts prepare readers for more advanced statistical analyses by helping them understand the characteristics and distribution of business data before drawing conclusions.
A significant portion of the book is dedicated to inferential statistical methods that enable decision-makers to draw conclusions about larger populations based on sample data. Analysis of Variance (ANOVA) is presented as an effective tool for comparing multiple groups and determining whether observed differences are statistically significant. Through carefully designed business scenarios and detailed Excel procedures, readers learn how ANOVA supports managerial decisions involving product performance, customer satisfaction, employee productivity, and operational efficiency.
The relationship between business variables is another important area covered extensively. Correlation analysis is introduced as a technique for measuring the strength and direction of relationships between variables, while regression analysis is explained as a predictive tool that helps organizations forecast future outcomes based on historical data. Readers learn how to interpret regression outputs, evaluate model accuracy, and apply predictive analytics to real-world business situations such as sales forecasting, demand estimation, pricing strategies, and financial planning.
Recognizing the importance of forecasting in modern organizations, the book includes a detailed discussion of time series analysis. Businesses frequently need to predict future trends in sales, production, inventory, customer demand, and market behavior. The book demonstrates how Excel can be used to identify trends, seasonal variations, and growth patterns, enabling readers to build reliable forecasting models. Practical examples illustrate how historical data can be analyzed to improve planning, budgeting, and strategic decision-making.
Quality management is another critical area addressed through the inclusion of Statistical Quality Control (SQC) techniques. Organizations striving for operational excellence require effective tools to monitor process performance and maintain consistent product quality. The book explains the use of control charts and other quality control methods using Excel, helping readers understand how statistical techniques contribute to continuous improvement, defect reduction, and enhanced customer satisfaction.
One of the distinguishing features of this book is its highly visual, step-by-step instructional style. Every analytical procedure is explained through detailed screenshots that illustrate each stage of the Excel process. This approach minimizes confusion and allows readers to replicate every analysis independently. By following the illustrated procedures, learners gradually build confidence in applying statistical tools without feeling overwhelmed by technical complexity.
The language throughout the book is deliberately simple, clear, and accessible. Complex statistical concepts are broken down into manageable components, ensuring that readers from diverse academic and professional backgrounds can understand the material. Mathematical derivations are kept to a minimum, while greater emphasis is placed on interpretation, practical implementation, and managerial relevance. This makes the book particularly useful for self-learners, classroom instruction, professional training programs, and executive education courses.
Beyond teaching individual statistical techniques, the book promotes analytical thinking and data literacy. Readers are encouraged to interpret results critically, understand the limitations of statistical methods, and make informed decisions based on evidence rather than intuition alone. The integration of statistical reasoning with practical Excel skills equips readers to address real organizational challenges confidently and effectively.
Upon completing the book, readers will have developed the ability to create and manage Excel worksheets, organize and clean business data, generate pivot tables and visualizations, perform descriptive and inferential statistical analyses, conduct ANOVA, correlation, and regression analyses, execute time series forecasting, and apply statistical quality control techniques to monitor and improve organizational performance. More importantly, they will possess the confidence to use Microsoft Excel as a practical analytical tool for solving business problems and supporting strategic decision-making.
Overall, this book serves as a comprehensive, application-oriented resource that combines statistical concepts with hands-on Excel implementation. By integrating theoretical understanding with practical business applications, it empowers readers to harness the power of data for better decision-making in an increasingly data-driven world. Whether used as a textbook, reference guide, or professional development resource, it provides the knowledge, skills, and confidence required to transform raw data into actionable business intelligence and contribute effectively to organizational success.
The primary objective of this book is to bridge the gap between statistical theory and its practical application in business environments. Rather than presenting statistical concepts in an abstract mathematical manner, the book demonstrates how these concepts can be effectively implemented using Excel. It is specifically designed for students, researchers, business professionals, entrepreneurs, managers, and anyone interested in learning how statistical tools can support better decision-making. No prior expertise in advanced statistics or Excel is assumed, making the content suitable for beginners while remaining valuable for experienced users seeking to strengthen their analytical skills.
The book begins by introducing readers to the fundamentals of Microsoft Excel, familiarizing them with its interface, essential functions, and worksheet operations. Readers learn how to create, organize, edit, and format spreadsheets efficiently, laying the foundation for more advanced analytical techniques. Since clean and well-structured data is the cornerstone of meaningful analysis, considerable attention is devoted to data preparation, organization, and management. The step-by-step approach ensures that readers become comfortable with Excel before progressing to more sophisticated statistical procedures.
One of the major strengths of the book is its emphasis on practical learning through real-world business examples and case studies. Every statistical tool is introduced in the context of solving genuine business problems. Instead of relying solely on theoretical explanations, the book demonstrates how statistical methods can be applied to marketing, finance, operations, production, human resource management, sales, customer analytics, and quality management. This practical orientation enables readers to understand not only how to perform statistical analyses but also why they are useful in specific business situations.
Data visualization plays a central role in communicating analytical findings, and the book provides extensive guidance on creating effective visual representations of data using Excel. Readers learn to construct charts, graphs, dashboards, and pivot tables that transform complex numerical information into clear and meaningful visual insights. These visualization techniques assist managers and decision-makers in identifying trends, patterns, and anomalies quickly, thereby facilitating evidence-based decision-making.
The book thoroughly explores descriptive statistical techniques that summarize and present data in an understandable manner. Measures of central tendency, variability, frequency distributions, and graphical representations are explained with practical examples. These foundational concepts prepare readers for more advanced statistical analyses by helping them understand the characteristics and distribution of business data before drawing conclusions.
A significant portion of the book is dedicated to inferential statistical methods that enable decision-makers to draw conclusions about larger populations based on sample data. Analysis of Variance (ANOVA) is presented as an effective tool for comparing multiple groups and determining whether observed differences are statistically significant. Through carefully designed business scenarios and detailed Excel procedures, readers learn how ANOVA supports managerial decisions involving product performance, customer satisfaction, employee productivity, and operational efficiency.
The relationship between business variables is another important area covered extensively. Correlation analysis is introduced as a technique for measuring the strength and direction of relationships between variables, while regression analysis is explained as a predictive tool that helps organizations forecast future outcomes based on historical data. Readers learn how to interpret regression outputs, evaluate model accuracy, and apply predictive analytics to real-world business situations such as sales forecasting, demand estimation, pricing strategies, and financial planning.
Recognizing the importance of forecasting in modern organizations, the book includes a detailed discussion of time series analysis. Businesses frequently need to predict future trends in sales, production, inventory, customer demand, and market behavior. The book demonstrates how Excel can be used to identify trends, seasonal variations, and growth patterns, enabling readers to build reliable forecasting models. Practical examples illustrate how historical data can be analyzed to improve planning, budgeting, and strategic decision-making.
Quality management is another critical area addressed through the inclusion of Statistical Quality Control (SQC) techniques. Organizations striving for operational excellence require effective tools to monitor process performance and maintain consistent product quality. The book explains the use of control charts and other quality control methods using Excel, helping readers understand how statistical techniques contribute to continuous improvement, defect reduction, and enhanced customer satisfaction.
One of the distinguishing features of this book is its highly visual, step-by-step instructional style. Every analytical procedure is explained through detailed screenshots that illustrate each stage of the Excel process. This approach minimizes confusion and allows readers to replicate every analysis independently. By following the illustrated procedures, learners gradually build confidence in applying statistical tools without feeling overwhelmed by technical complexity.
The language throughout the book is deliberately simple, clear, and accessible. Complex statistical concepts are broken down into manageable components, ensuring that readers from diverse academic and professional backgrounds can understand the material. Mathematical derivations are kept to a minimum, while greater emphasis is placed on interpretation, practical implementation, and managerial relevance. This makes the book particularly useful for self-learners, classroom instruction, professional training programs, and executive education courses.
Beyond teaching individual statistical techniques, the book promotes analytical thinking and data literacy. Readers are encouraged to interpret results critically, understand the limitations of statistical methods, and make informed decisions based on evidence rather than intuition alone. The integration of statistical reasoning with practical Excel skills equips readers to address real organizational challenges confidently and effectively.
Upon completing the book, readers will have developed the ability to create and manage Excel worksheets, organize and clean business data, generate pivot tables and visualizations, perform descriptive and inferential statistical analyses, conduct ANOVA, correlation, and regression analyses, execute time series forecasting, and apply statistical quality control techniques to monitor and improve organizational performance. More importantly, they will possess the confidence to use Microsoft Excel as a practical analytical tool for solving business problems and supporting strategic decision-making.
Overall, this book serves as a comprehensive, application-oriented resource that combines statistical concepts with hands-on Excel implementation. By integrating theoretical understanding with practical business applications, it empowers readers to harness the power of data for better decision-making in an increasingly data-driven world. Whether used as a textbook, reference guide, or professional development resource, it provides the knowledge, skills, and confidence required to transform raw data into actionable business intelligence and contribute effectively to organizational success.
Sample Chapters
Sample Chapters will be added soon…
Build Author or Publisher Website in Minutes
- Design a stunning professional website in minutes to showcase your portfolio, new releases, series, and bestselling titles.
- Use world-class cataloging software to create the metadata of your books. You will forget managing your metadata in excel.
- Share your large cover image and real-time metadata in with the publishing industry.
- Promote your books seamlessly across the Booksdata.org ecosystem and connect directly with a highly engaged reading community.